










Why Personal Injury Lawyers Get Fewer Cases in the First Quarter of Every Year
Jason Bland | April 1, 2026

The single most important structural driver of low Q1 interest is the reduction in vehicle miles traveled (VMT) during January and February.
From most personal injury lawyers’ perspective, it doesn’t make sense. People are always getting into accidents, so why are there seasonal dips and surges in personal injury leads?
I’ve been doing law firm SEO for a long time and it seems like every year, prospective clients call us wondering what happened after the holidays. My personal injury clients start emailing me asking if their keyword rankings are still solid. If anything has changed with their PPC campaigns. But the reality is that even with solid rankings, high impression share on their PPC campaigns, consistent spend on social media, TV, outdoor advertising, and other channels, the combined interest in finding a personal injury lawyer is just lower in January, February, and March.
Table of Contents
Your Competitors Are Experiencing the Same Slump
In the dataset that powers our AI law firm marketing platform, CLM Sequoia, we have reports from law firms that work with our competitors, giant firms that do most of their marketing in-house, and firms that put most of their marketing dollars in one or two channels (ie: big TV spend but low internet spend.) It truly is a comprehensive look at the personal injury world at large. This is our window into the law firm marketing industry outside of CLM’s client base.
The Quarter 1 slowdown (with very few outliers) is universal. Google Trends confirms that.
Search Interest for Personal Injury Legal Terms Across 2025
lawyer
attorney
lawyer
attorney
lawyer
lawyer
I have to know... what causes PI leads to be lower during the first part of the year?
I started my research by focusing on the post-pandemic years of 2022, 2023, 2024, and 2025. Then I looked at regional differences. The trend appeared in temperate climates like Southern California and harsh winter climates like Chicago. It affects organic search, direct traffic, referral traffic, and social traffic simultaneously. And it affects every major personal injury search term, from "car accident lawyer" to "dog bite lawyer" to "medical malpractice lawyer."
Personal injury categories covering everything from car accidents to work accidents have tons of reliable data from cities, states, and at the federal level. Since this Q1 phenomenon seems to be nationwide, I grabbed federal data from the National Highway Traffic Safety Administration (NHTSA), the Federal Highway Administration (FHWA), the Bureau of Transportation Statistics (BTS), the National Safety Council (NSC), the Governors Highway Safety Association (GHSA), Occupational Safety and Health Administration (OSHA), peer-reviewed research, and cross-industry consumer behavior data. The picture that emerges is not a single cause but a convergence of reinforcing factors that suppress the supply of new personal injury incidents while simultaneously suppressing consumer willingness to act on injuries that have already occurred.
Car Accidents: Americans Drive Far Fewer Miles in January and February
The single most important structural driver of low Q1 interest is the reduction in vehicle miles traveled (VMT) during January and February. This matters because motor vehicle crashes generate the largest share of personal injury cases in the United States, and miles driven is the primary exposure variable that determines how many crashes occur. In the Google Trends chart above, you can see the red line tracking interest in car accident lawyers throughout last year.
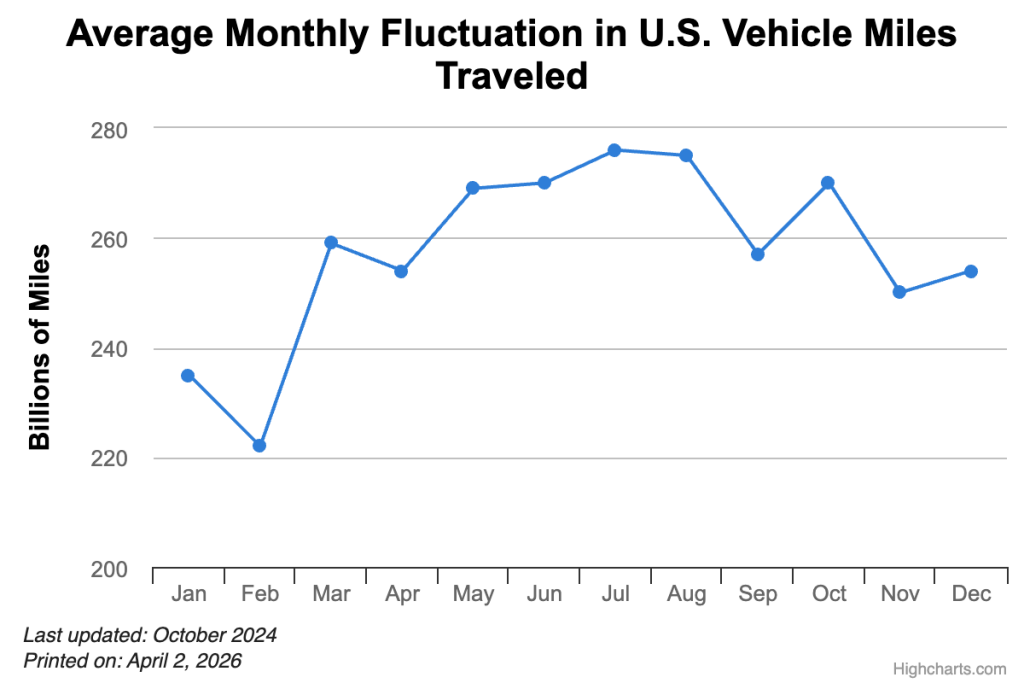
The Federal Highway Administration collects VMT data from approximately 5,000 continuous traffic counting locations nationwide and publishes the findings in its monthly Traffic Volume Trends reports. According to the Department of Energy's Alternative Fuels Data Center, which aggregates FHWA data averaged across 2010 to 2023, U.S. drivers log the fewest vehicle miles at the beginning of each year in January and February, with peak mileage occurring in July. The Bureau of Transportation Statistics confirms that seasonal movement in VMT results in August ranking highest and February ranking lowest within a calendar year.
NHTSA's detailed monthly data from its 2023 fatality projections report (DOT HS 813 561) provides precise VMT figures that quantify this gap. In 2023, February VMT was 235.5 billion miles. August VMT was 290.9 billion miles. That is a difference of 55.4 billion miles, or roughly 19 percent fewer miles driven in February compared to August.
The 2022 data shows the same pattern. February VMT was 231.1 billion miles versus August at 284.3 billion miles, a gap of 18.7 percent.
This is not a marginal difference. It represents tens of billions of fewer miles of road exposure every month during Q1.
VMT Drops Nationwide Even When Winter Weather isn't a Factor
This is the insight that explains why the Q1 pattern holds in Florida and Arizona as well as Michigan and Minnesota. The VMT reduction is not primarily weather-driven. It is driven by structural factors that apply across the entire country.
The holiday travel season ends abruptly in early January. The Thanksgiving-through-New Year's corridor generates massive cross-country travel, family visits, and recreational driving. In January, that demand disappears. There are no major vacation windows between early January and spring break in March. Children are in school with no extended breaks. Daylight hours are at their shortest across the entire continental United States, including in warm-weather states, which reduces discretionary driving, evening errands, recreational outings, and outdoor activities that generate road exposure.
The Bureau of Transportation Statistics confirmed this interpretation through its *seasonal adjustment methodology. BTS found that after removing seasonal effects, February VMT and August VMT are actually close to identical, and in several years (2005, 2006, 2008, 2009, 2011, and 2012), seasonally adjusted February VMT actually exceeded seasonally adjusted August VMT. This means the raw Q1 VMT depression is almost entirely attributable to the absence of discretionary and recreational travel, not weather-related driving avoidance.
*Seasonal adjustment is a statistical method that strips out predictable, recurring patterns (like summer road trips or holiday travel) from the raw data so analysts can see whether the underlying level of activity is actually changing or just following the same calendar-driven cycle it follows every year.
Fewer Accidents, Fewer Injuries, Fewer Searches
The VMT reduction translates directly into fewer motor vehicle accidents, injuries, and fatalities during Q1.
NHTSA publishes quarterly fatality projections in its CrashStats reports. The data, compiled from FARS Final Files (2013 to 2022), the FARS Annual Report File (2023), and statistical projections for 2024 and 2025, shows that Q1 consistently records the lowest fatality count of any quarter. This is not an occasional pattern. In every single year from 2013 through 2025, Q1 recorded the lowest number of traffic fatalities. There are no exceptions across 13 consecutive years.
The numbers are stark. In 2019, the pre-pandemic baseline year, Q1 recorded 7,832 fatalities versus Q3's 9,994, a gap of 27.6 percent. In 2022, Q3 fatalities (11,588) exceeded Q1 fatalities (9,515) by 21.8 percent. In 2023, the gap was 24.9 percent.
Within Q1, the monthly pattern is equally consistent. February is the single least deadly month in every observed year. In 2022, February recorded 2,987 fatalities (the year's lowest) while October recorded 3,973 (the year's highest). In 2023, February recorded 2,875 versus October's 3,815. In 2024, February's projected count was 2,725 versus August's 3,650, a gap of 25.3 percent.

The National Safety Council corroborates this as a longstanding structural pattern, noting that over the last several years, January and February generally experienced the fewest motor-vehicle fatalities, while July, August, or October experienced the most.
The Fatality Rate Per Mile Also Drops in Q1
Even when adjusting for the reduced miles driven, Q1 records lower fatality rates per 100 million VMT than the summer and fall quarters. In 2023, the Q1 fatality rate was 1.18 per 100 million VMT, compared to 1.30 in Q3 and 1.29 in Q4. In 2019, the Q1 rate was 1.05 versus Q3's 1.18.
This means that even controlling for the fact that fewer miles are driven, each mile driven during Q1 is statistically less dangerous than a mile driven during Q3 or Q4. This further suppresses the pool of potential personal injury claimants.
Beyond Car Accidents: Why Non-Driving Personal Injury Categories Also Follow Seasonal Patterns
Motor vehicle crashes are not the only source of personal injury cases. Dog bites, workplace injuries, slip and falls, all contribute to the caseload. The question is whether these categories also experience Q1 suppression, or whether they operate independently of the driving-related dynamics described above.
Dog Bites
Approximately 4.5 million dog bites occur annually in the United States, according to the CDC. Roughly 800,000 require medical attention, and in 2022, emergency departments treated a record 395,036 dog bite cases.
Dog bites follow a clear seasonal pattern. Research published by Nemours Children's Health found a significant increase in the national incidence of dog bite injuries among children during the spring and summer months across a 10-year observation period. A peer-reviewed study published in Scientific Reports (Nature, 2023) analyzed 69,525 reports of dogs biting humans across eight U.S. cities from 2009 to 2018 and found that bite rates increase with increasing temperature and UV irradiation. The study documented a 4 percent increase in dog bite rates on hotter days and an 11 percent increase on sunny days.
The mechanism is straightforward: warmer months bring more outdoor activity, more human-dog interactions in parks and neighborhoods, more children playing unsupervised outside, and, according to the Scientific Reports study, physiological changes in dogs themselves related to heat and stress. In January and February, all of these interaction vectors are suppressed.
Workplace Injuries
Workplace injuries present a more nuanced picture. Indoor workplace injuries in warehouses, manufacturing plants, and office environments are not inherently seasonal in the same way that traffic accidents or dog bites are. An assembly line worker can be injured in January as easily as in July.
However, the data shows that the aggregate picture does include seasonal variation. A time series analysis published in the Journal of Safety Research examined OSHA Severe Injury Reports (SIRs) from 2015 to 2021 and found that the highest mean number of severe workplace injuries were reported in June, July, and August. The same study noted that the manufacturing and construction industries reported the largest number of SIRs, and among construction contractors specifically, a summertime peak in severe injuries has been attributed to longer working hours, fatigue from extended daylight, and lean crews during vacation months.
A companion cross-sectional analysis of OSHA SIR data from 2015 to 2022, also published in the Journal of Safety Research, reported 83,338 severe workplace injuries across the 29 states under federal OSHA coverage. While the study found summertime peaks in SIRs, it noted that the seasonal differences were not statistically significant when examining SIRs by industry or injury factor.
The takeaway is that workplace injuries do show some Q1 softness, particularly in construction and outdoor trades, but the effect is weaker and less consistent than for driving-related injuries. Indoor workplace injuries, including the warehouse, manufacturing, and logistics injuries that generate many workers' compensation and personal injury claims, do not exhibit the same clear seasonal pattern. This is one area where the Q1 search dip is harder to explain through incident volume alone.
Pedestrians and Cyclists
Pedestrian and cyclist fatalities are strongly seasonal, which makes sense as they are related to driving trends. NHTSA reports that 7,314 pedestrians were killed and more than 68,000 were injured in traffic crashes in 2023. The Governors Highway Safety Association reports that pedestrian deaths rose 80 percent between 2009 and 2023, with nighttime fatalities driving much of the increase. Fatal pedestrian crashes at night rose 84 percent between 2010 and 2023, compared to a 28 percent increase during the daytime.
NHTSA's 2023 pedestrian data fact sheet reports that 77 percent of pedestrian fatalities occurred in the dark, and the fall months (October through December) record disproportionately high pedestrian death counts due to the combination of earlier darkness and continued outdoor activity. Q1, with its shorter days and reduced pedestrian foot traffic, generates fewer pedestrian injury incidents.
Cyclist fatalities follow the same pattern. NHTSA reported 1,166 pedalcyclist fatalities in 2023. Cycling activity is heavily concentrated in warmer months, and January and February represent the annual low point for cyclist crashes in virtually every U.S. market.
Motorcycle Crashes
Motorcycle fatalities are among the most seasonal of all PI case categories. NHTSA data shows 6,335 motorcyclists were killed in 2023, representing 15 percent of all traffic fatalities despite motorcycles accounting for only 3 percent of registered vehicles. Analysis of a decade of NHTSA FARS data (2013 to 2022) confirms that June, July, and August are the most dangerous months for motorcycle riders, while January, February, and December show the lowest fatality counts. Approximately 60 percent of all motorcycle fatalities occur during the May through September period. Motorcycle-related PI cases are effectively absent from the pipeline during Q1.
Why Injuries Do Not Immediately Generate Legal Searches
Even when accidents do occur during Q1, there is a delay between the incident and the victim's decision to search for legal representation.
Individuals injured in motor vehicle crashes do not immediately search for a lawyer. The typical progression involves emergency medical treatment (hours to days), initial insurance contact (days to weeks), a medical evaluation period where the victim assesses whether their injuries are resolving (weeks to months), and an insurance dissatisfaction trigger where the victim realizes the insurer is offering an inadequate settlement or denying the claim (weeks to months). Only then does legal search initiation begin.
This lag means that a significant portion of December holiday-period crashes, which include the New Year's Eve spike that NHTSA data identifies as one of the highest-risk periods for alcohol-impaired driving, do not generate attorney searches until February or March. January accidents may not generate searches until March or April.
The lag effect compresses Q1 search volume and inflates Q2, making the apparent seasonal swing in search data even more pronounced than the underlying incident data alone would suggest.
Psychology is Also a Factor. The Q1 Consumer Behavior Slowdown Is Cross-Industry, Not Unique to Legal
One of the most useful external data points for understanding the Q1 dip comes from outside the legal industry entirely.
RioSEO publishes quarterly analyses of local consumer search behavior across more than 230,000 enterprise business locations in seven industries: retail, financial services, business services, healthcare, hospitality, restaurants, and multi-family residential. Their Q1 2025 report documented a broad contraction in consumer search engagement that spans nearly every sector.
Retail experienced the most visible Q1 pause, with mobile visibility shrinking while desktop Maps views ticked up. RioSEO characterized this shift as reflecting more intentional, research-based behavior: fewer spur-of-the-moment actions, more careful consideration. They explicitly noted that Q1 often brings a post-holiday pause in shopping urgency. Total clicks for multi-family residential dropped 23 percent year over year, and financial services saw total clicks decline 15.7 percent, with phone inquiries falling fastest.
The restaurant sector saw the steepest drop in visibility at negative 38.2 percent, with food orders declining 40.4 percent and menu clicks dropping 33.3 percent. Healthcare was the exception that proved the rule, with views up 13.5 percent and website clicks rising 21 percent year over year, driven by cold and flu season demand.
What makes this data valuable for understanding the PI search dip is that it demonstrates the Q1 contraction is not unique to legal services. It is a broad consumer behavior pattern. People across virtually every category of local search are less engaged, less impulsive, and more deliberate during January and February. This does not mean consumers are avoiding legal help because of cost. Personal injury attorneys work on contingency, so there is no out-of-pocket expense to the client. Rather, the Q1 pause appears to reflect a general reduction in action-taking behavior across the board. People defer decisions. They are in a post-holiday recalibration period that affects how they interact with local businesses of every kind, including law firms.
We're Still Left With a Few Mysteries
It is important to be transparent about the limits of this analysis.
The factors described above, reduced VMT, reduced crash volume, seasonal absence of motorcyclists and pedestrians, and the injury-to-search lag, convincingly explain why motor vehicle, motorcycle, pedestrian, cyclist, and dog bite PI cases follow a Q1 seasonal pattern. These categories collectively represent the majority of personal injury caseloads.
However, certain categories of personal injury cases are not as neatly explained by these dynamics.
Indoor workplace injuries and warehouse injuries are not inherently seasonal. Someone who is injured by a forklift in a distribution center or who suffers a repetitive stress injury on a manufacturing line is no more or less likely to be hurt in January than in July. The OSHA time series data shows summertime peaks in aggregate severe injury reports, but the seasonal difference was not statistically significant across industries. For indoor workplace injury and workers' compensation cases specifically, the Q1 search dip may be driven more by the demand-side behavioral factors (the general consumer pause, the injury-to-search lag) than by a reduction in actual incident volume.
Similarly, medical malpractice occurs on a schedule dictated by medical procedures, not by weather or road conditions. Surgical errors, misdiagnoses, and medication mistakes happen year-round. Any Q1 softness in medical malpractice search volume is almost certainly a demand-side phenomenon, not a supply-side one.
Slip-and-fall cases present an interesting edge case. In cold-weather markets, slip-and-fall injuries may actually increase during winter months due to ice and snow. In temperate markets, they may track more closely with foot traffic patterns, which decline in Q1 along with general outdoor activity. The net effect across a nationwide dataset appears to be mild Q1 suppression, but the dynamics vary significantly by geography and can change annually depending on weather patterns.
Springtime Will Be Busier
The Google Trends data consistently shows search interest beginning to recover in late March and accelerating through April, May, and June. The February-to-March VMT (vehicle miles traveled) surge is the most dramatic illustration of why.
In 2023, VMT jumped from 235.5 billion miles in February to 273.7 billion miles in March, a 16.2 percent increase in a single month. That 38.2 billion-mile jump represents the largest month-over-month VMT increase of the year.
March and April bring spring break travel, the beginning of motorcycle season, the ramp-up of highway construction zones, longer daylight hours, and increased pedestrian and cyclist activity. At the same time, the lagged Q1 injuries begin generating searches, and the general consumer behavior pause that was documented across most industries begins to lift.
This is why the late March to early April period shows the sharpest upward inflection in the Google Trends data every year. It represents the simultaneous reversal of every Q1 suppression factor.
What This Means for Personal Injury Law Firm Marketing
The most damaging mistake would be to put your marketing in hibernation during the softest time of year. This would create ranking and visibility gaps that competitors can and will exploit. Firms that maintain consistent investment through Q1 are better positioned to capture the spring demand surge when it arrives.
The reduced demand period is ideal for infrastructure investment. Use that extra time to draft thought leadership articles, record some videos for your social media, and look for new case results in your case management system to share with your marketing team. Firms can also shift messaging to match the case types that are slightly less affected by seasonal dynamics, such as workers' compensation claims, medical malpractice, and indoor workplace injuries (warehousing, distribution, assembly lines, etc.)
The Q1 slowdown is as predictable as tax day, and now, we know why.

Jason Bland
Jason Bland is a Co-Founder of Custom Legal Marketing. He focuses on strategies for law firms in highly competitive markets. He's a contributor on Forbes.com, is a member of the Forbes Agency Council and has been quoted in Inc. Magazine, Business Journals, Above the Law, and many other publications.

The Definitive Guide to Law Firm SEO That Works
Law Firm SEO That Works is where we show attorneys what their competitors wish they knew.